Visibility of operations and security is extremely important to the success of every business. While the type of visibility required varies based on the type of business or industry, the end goal remains the same. Organizations today require instant access to relevant information about the efficiency and profitability of operations.
Our Software allows management to quickly identify areas that require attention. The configuration of our Software allows it to track staff productivity, equipment health and status, multiple types of inventory, and products as they travel through production. It can also track security and access.
Full integration provides a holistic view of operations. Information is displayed in clear, easy to read and understand text and diagrams. Users can click on various areas displayed on the screen to access additional information about each component tracked by the Software.
Alerts/Notifications
Alerts are shown in red and provide real-time information about security issues, unauthorized access attempts, equipment maintenance issues, holdups or delays, as well as issues relating to productivity. Alerts and Key Performance Indicators (KPIs) appear on every screen.
The information collected from our hardware and sensors is fully analyzed to locate potential problems. Notifications are sent via email and SMS text message. An indicator appears in red on each page of the dashboard, alerting users of the type and location of the issue.
Thresholds/Rules Engine
The Rules Engine allows messages from our sensors and devices to be processed based on a configurable set of rules. It sequentially applies these configured rules to incoming messages from devices installed throughout the facility. Although rules are applied sequentially, rule execution is asynchronous and based on actors. This allows for the processing of messages in the same order they are received without affecting performance. It’s the Rules Engine that enables our system to send alerts when problems are detected.
Global Overview Dashboard
The main screen viewed by users of our Software is the Global Overview. This screen summarizes the status of the facility. Status is clearly labeled in easy to understand language and colors.
If tracking multiple facilities, the Global Overview displays the status of each location. Colored dots in red, yellow, and green label tracked items. Red indicates a critical status, yellow indicates a warning, and green indicates that the facility is running within the normal range for operation.
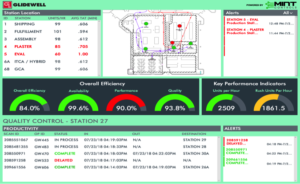
In the image above, Mint Controls’ Software is tracking manufacturing plant equipment health for an organization with multiple facilities. Users can quickly locate the status of each facility. Color-coded dots show status. The location, status, and items produced at each location are shown in the center of the screen. On the right, users can view the time and type of alerts experienced at each facility. KPI is shown at the bottom of the screen as well as overall equipment efficiency across all facilities owned by the manufacturer.
Facility View Dashboard
![]()
![]()
From the Global View, users can click on a specific area to view its performance. The Facility View screen displays a detailed view of specific sites or stations. Users can access specific information about each tracked component within each individual area.
In the following diagram, our Software is tracking consignment inventory as it moves from one station to the next. Areas where holdups occur are displayed in red. Users can quickly locate the number of units per hour processed by each station. Alerts are displayed on the right side of the screen in red. These alerts show management exactly which areas require attention. KPIs per station are shown in the center of the screen. Productivity is tracked at the bottom of the screen. Alerts on the bottom right show which product is delayed.
From the Facility View, users can click on specific areas to access more detailed information. This will vary widely based on the type of business and industry, and the type of tracking system being used.
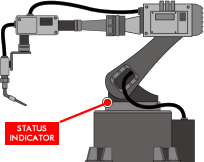
 The manufacturer mentioned above can click on alerts and drill down to view the piece of equipment experiencing problems. Here, users can view in-depth details about the history of the machine, alerts regarding the machine, and its overall performance. A red dot indicates the exact location of the issue as seen in the image to your left.
In the case of the consignment inventory company, information is provided per patient, date received, and location. Users can click the “Get Package Location” button at the top right of the screen to access the exact location of each product. This was especially important to the company Mint Controls provided this solution to, as they were losing a lot of money on lost products.
KPIs
Mint Controls’ Software tracks overall efficiency and Key Performance Indicators (KPIs). This information is displayed on the bottom of each screen. KPI images change color based on the status of the object being tracked.
The software is customizable and can be configured to track a number of KPIs including energy usage, air quality, rate of production, and more.
